Understanding the RSI Indicator: A Beginner’s Guide
The Relative Strength Index (RSI) is a popular technical analysis tool used by traders to measure the momentum of price movements in financial markets. It helps identify whether an asset is overbought or oversold, signaling potential price reversals or continuation patterns.
What is RSI and How is it Used?
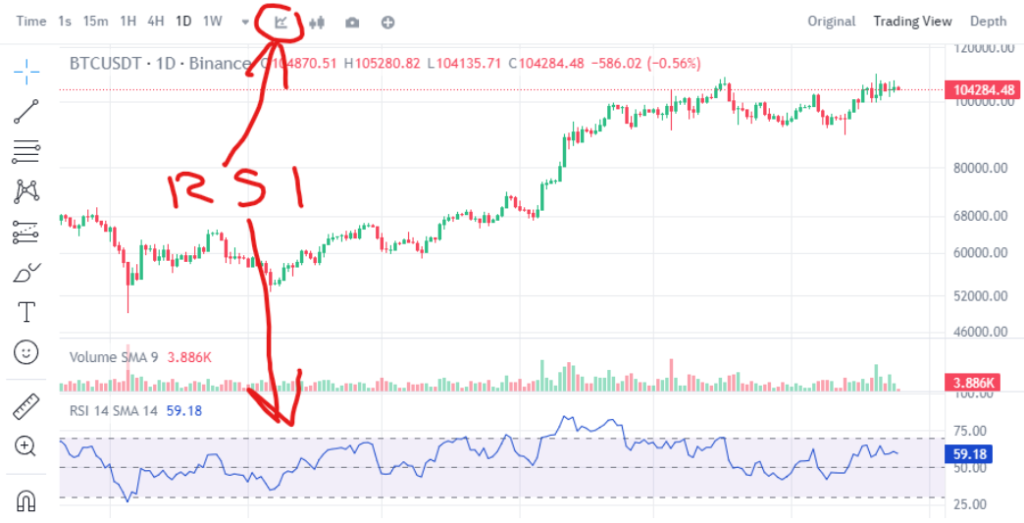
RSI is a momentum oscillator that ranges between 0 and 100. It is typically calculated over a 14-period timeframe (e.g., 14 days for daily charts). The formula compares the magnitude of recent price gains to recent losses, providing insights into the asset’s momentum.
- Overbought Zone (>70): When RSI exceeds 70, it suggests the asset may be overbought, meaning its price has risen significantly in a short time and might be due for a correction.
- Oversold Zone (<30): When RSI falls below 30, it indicates the asset might be oversold, suggesting it could be undervalued and might experience a rebound.
Can Price Continue Rising if RSI > 90?
Yes, an asset’s price can continue to rise even if RSI exceeds 90. While an RSI above 90 is extremely rare and indicates strong bullish momentum, it doesn’t guarantee an immediate reversal. In some cases, prices can remain in the overbought zone (above 70 or even 90) for an extended period, especially during strong uptrends or parabolic moves. However, such extreme RSI levels often indicate heightened risk, and traders should proceed cautiously.
Why Should You Monitor RSI?
- Identify Reversal Points: RSI can signal potential turning points in the market, helping traders anticipate when a trend might reverse.
- Assess Momentum Strength: It provides insights into the strength of the current trend, helping traders confirm whether the price movement is sustainable.
- Avoid Overextended Moves: Monitoring RSI can help traders avoid entering positions when the market is overbought or oversold, reducing the risk of being caught in a correction.
Key Takeaways
- RSI is a valuable tool for identifying overbought and oversold conditions in the market.
- Prices can continue to rise or fall even in extreme RSI conditions, but such moves are often unsustainable in the long term.
- Use RSI in combination with other indicators and analysis techniques for more reliable trading decisions.
By understanding and tracking RSI, traders can make more informed decisions and better manage their risks in the financial markets.
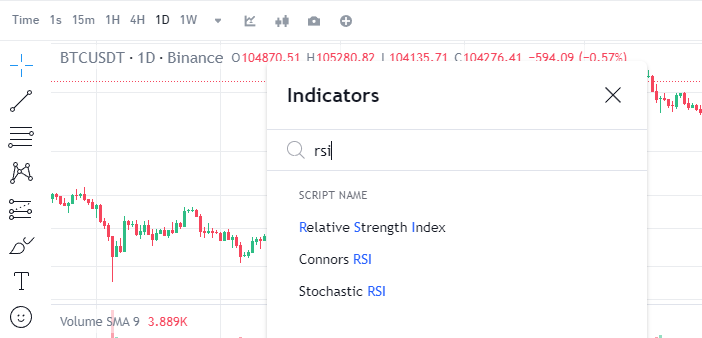
How to enable